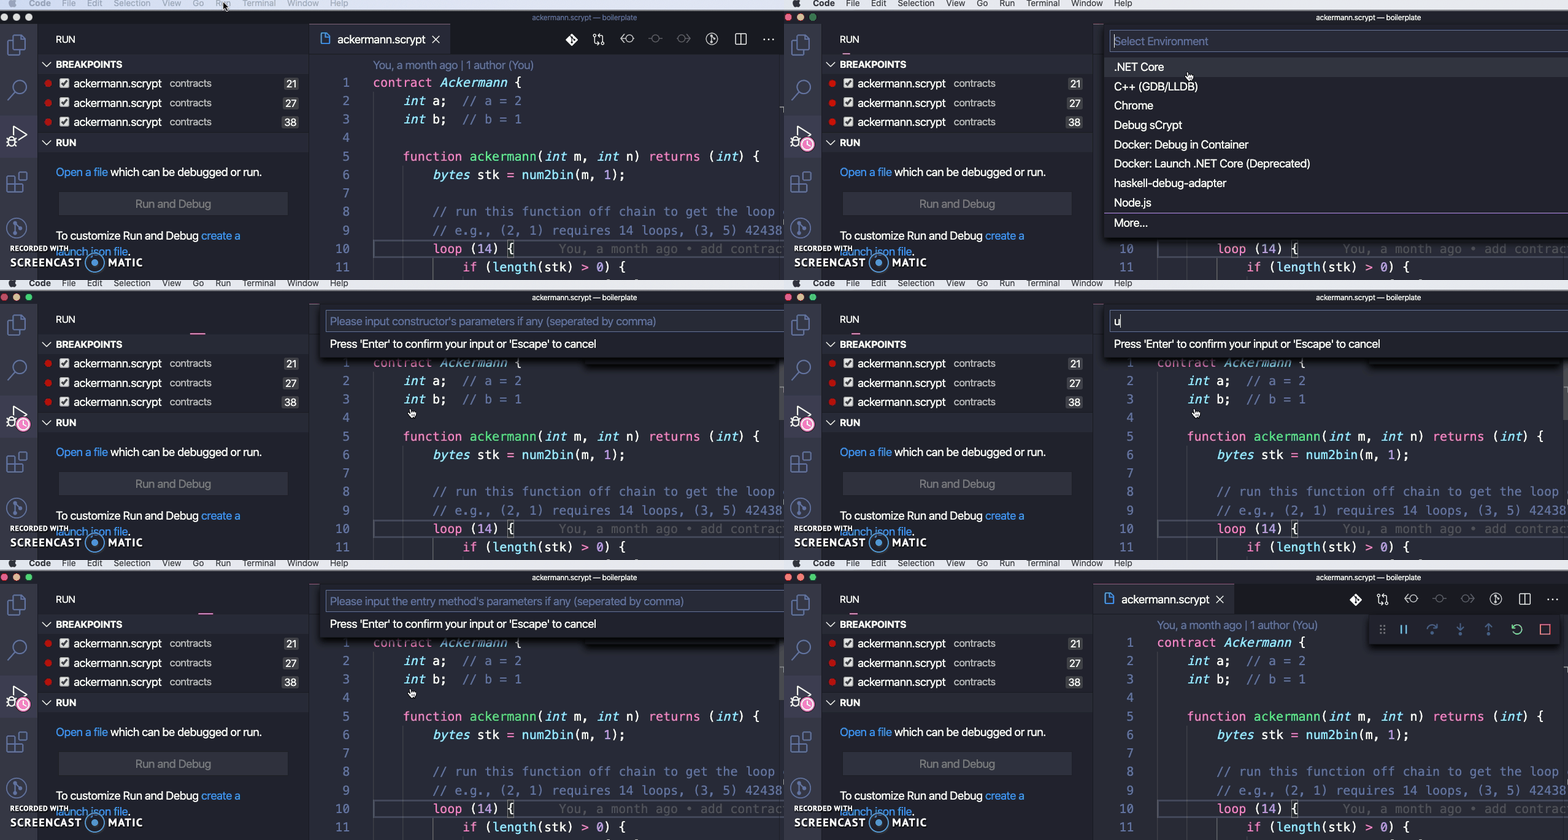
Today we are extremely excited to announce the biggest improvement since we first released our IDE, a source-level sCrypt debugger. It supports breakpoints, stepping, stack trace, and variable inspection, all of which are tremendously helpful for developers to find and fix bugs.
How to Use the Debugger
Simply create a launch.json file located in your workspace's .vscode folder and hit F5 to start debugging.

As in other VSCode debuggers, thelaunch.jsonfile stores debugging configurations. Below is a reference on launch.json attributes specific to the sCrypt debugger.

type and request attributes are fixed. Other attributes are:
- name: name of the debugging session
- program: an absolute path to the sCrypt program to debug. ${workspaceFolder} is a predefined variable referring to the path of the folder opened
- constructorParams: constructor arguments in sCrypt literal format, separated by commas
- entryMethod: public function name
- entryMethodParams: function arguments in sCrypt literal format, separated by commas
Alternative to Launch Debugger
You can also launch the debugger without a launch.jsonfile. Simply open the .scrypt source file you want to debug and hit F5.

For more general information on debugging in VSCode, you can visit this and this.
Happy debugging!
